- Published on
How to set up TrueNAS metrics on Grafana & InfluxDB
- Authors

- Name
- Jack Burgess
- GitHub
- @jack828
Preamble
Like some other TrueNAS 12 users, my dashboard’s metrics graphs don’t work, even on a first-time install! So, to satiate my need for data, I decided to use Grafana.
There’s a community plugin for Grafana & InfluxDB1 - but a pre-packaged version is no fun. Let’s learn to do it ourselves.
Fair warning, we’ll be using both the GUI and command line, so this guide does assume you’re able to SSH in (using key-based auth, hopefully!) the rest of the steps will be very hand-holdy.
In the code blocks in this post, the lines that start with truenas% are run on the TrueNAS CLI, and root@grafana:/ # are run within the jail CLI.
The Jail
We’ll need somewhere for all our work to live. Instead of cluttering up the system with many jails for each service, I like to group logically similar processes into one jail for ease of use. That means one jail will contain both our Grafana and InfluxDB services.
Before we create it, we’ll need to see what is the latest release we should be using:
truenas% sudo iocage fetch
[0] 11.2-RELEASE (EOL)
[1] 11.3-RELEASE (EOL)
[2] 11.4-RELEASE
[3] 12.0-RELEASE (EOL)
[4] 12.1-RELEASE
[5] 12.2-RELEASE

Type the number of the desired RELEASE
Press [Enter] to fetch the default selection: (Not a RELEASE)
Type EXIT to quit: ^C
Aborted!
We can see that the latest is 12.2-RELEASE so our jail creation command will be:
truenas% sudo iocage create -n grafana \
  -r 12.2-RELEASE boot=on vnet=on allow_tun=1 \
  ip4_addr="vnet0|192.168.0.100/24" \
  allow_sysvipc=1 bpf=yes
Once that’s done, go ahead and log into the shell for it:
truenas% jls
   JID  IP Address    Hostname    Path
    18                grafana     /mnt/tank/iocage/jails/grafana/root
truenas% sudo jexec 18 tcsh
root@grafana:/ #
Processes
Now, let’s set up our metrics processes. You’ll need to install the influxdb and grafana72 packages.
You can also take the opportunity to install your preferred editor of choice - I’ll use nano because it’s more lightweight than importing my vim config.3
root@grafana:/ # pkg install -y nano influxdb grafana7
Now enable and start the InfluxDB and Grafana services:
root@grafana:/ # sysrc influxd_enable="YES"
root@grafana:/ # sysrc grafana_enable="YES"
root@grafana:/ # service influxd start
root@grafana:/ # service grafana start
Let’s verify our InfluxDB is working correctly, and also get our database ready for metrics. Hop into the InfluxDB shell and create a graphite database.
root@grafana:/ # influx
Connected to http://localhost:8086 version 1.8.0
InfluxDB shell version: 1.8.0
> create database graphite
> show databases
name: databases
name
----
_internal
graphite
Now we need to modify our InfluxDB config4 - it lives here: /usr/local/etc/influxd.conf. Open that file in your editor, and head to the [[graphite]] section.
I recommend having a good read of the file - you might find it does something else you like the look of!
For Graphite metrics, this is what you could set the settings to: (I am only showing lines I am modifying - read carefully)
###
### [[graphite]]
###
### Controls one or many listeners for Graphite data.
###
[[graphite]]
  # Determines whether the graphite endpoint is enabled.
  enabled = true
  database = "graphite"

  # retention-policy = ""
  bind-address = ":2003"
  protocol = "tcp"
  consistency-level = "one"

  # These next lines control how batching works. You should have this enabled
  # otherwise you could get dropped metrics or poor performance. Batching
  # will buffer points in memory if you have many coming in.

  # Flush if this many points get buffered
  batch-size = 5000

  # number of batches that may be pending in memory
  batch-pending = 10

  # Flush at least this often even if we haven't hit buffer limit
  batch-timeout = "1s"
After editing that config file, you’ll need to restart the service with service influxd restart for it to pick up the changes.
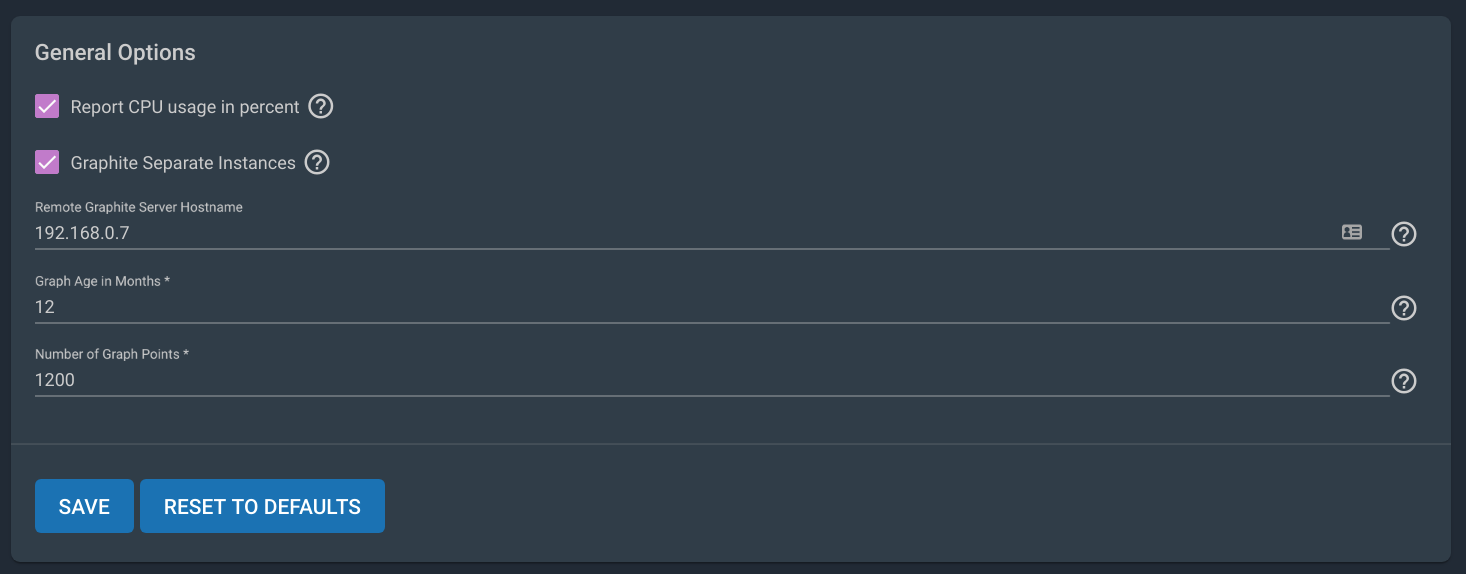
Now, we need to tell our TrueNAS where to dump its metrics data. In the GUI, head to System → Reporting, and add your grafana jail’s IP address into Remote Graphite Server Hostname. Optionally, you can change it so it reports CPU usage in %.
Hit save and head back to the jail command line. We’re going to check to see if it’s recording any metrics.
root@grafana:/ # influx
Connected to http://localhost:8086 version 1.8.0
InfluxDB shell version: 1.8.0
> use graphite
> show series
key
----
servers.truenas_local.aggregation.cpu-average.cpu.idle
servers.truenas_local.aggregation.cpu-average.cpu.interrupt
servers.truenas_local.aggregation.cpu-average.cpu.nice
servers.truenas_local.aggregation.cpu-average.cpu.system
...omitted for brevity...
If you see all the series, great! Let’s move on.
Grafana
Head to http://jail.ip.address:3000/datasources and let’s set up Grafana. Click Add data source and choose InfluxDB.
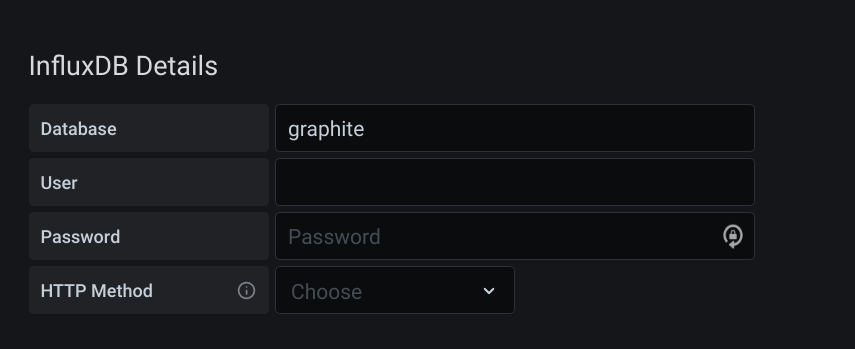
Set the URL to http://localhost:8086 and your database to graphite (as we set up earlier).
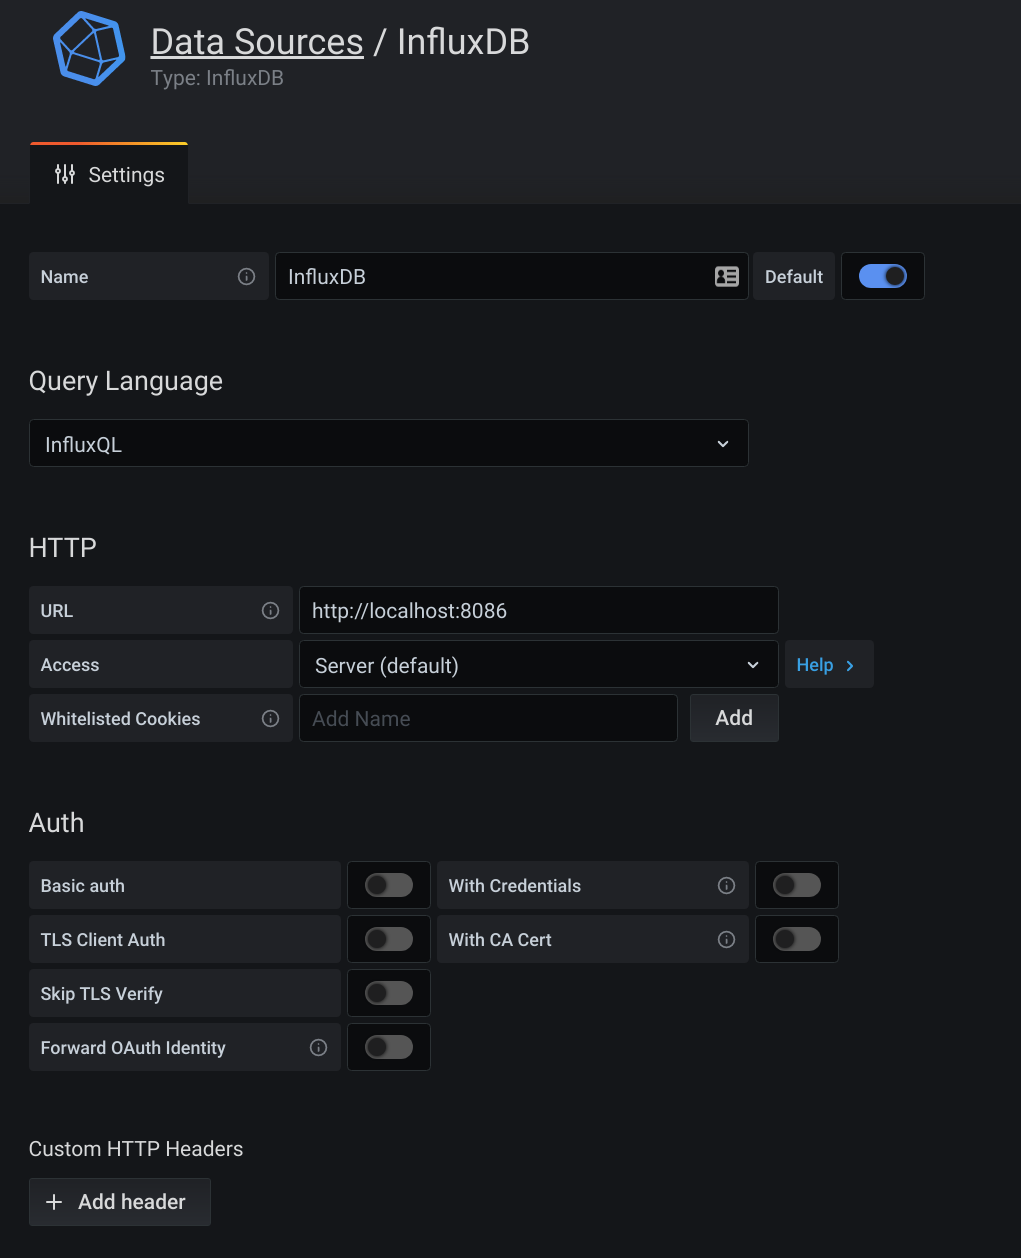
Smash Save & Test and you should see a beautiful green banner letting you know all is good.

Templates
Now that this is done - if you’re happy setting up multiple queries on long measurements then we’re all done! Head to Grafana and set up the dashboard as you like!
However, we can utilise the powerful templates feature of InfluxDB’s Graphite parser to make this data a little more friendly.
Head back to the [[graphite]] section of the config /usr/local/etc/influxd.conf.
So this is where it gets a little complicated to explain - you see in InfluxDB when you run show series the huge number of different metrics being collected. We’ll focus, for now, on the disktemp metrics series.
The series in InfluxDB is this - servers.truenas_local.disktemp.da0.temperature - with a value key holding the actual temperature (in Celsius), for the da0 disk.
This isn’t necessarily a bad way of storing the metric - but you’ll need many queries equal to the number of disks you have to show this in Grafana! If you ever add more disks, you’ll need to amend all your graphs to have the additional query.
So, let’s fix this by filtering the series to only all the disktemp ones, and parse it into a single series. We want our resultant series to be filterable by each disk and have appropriately named fields.
We do this by utilising the powerful templates option in the config. Each line is made up of a filter, then a template for aggregating the metric, with optional tags.
We want to group the metrics in the disktemp.* series together, and tag them with disk information.
Our filter can be inferred from the series from before - servers.truenas_local.disktemp.da0.temperature - this translates to servers.host.property.property.field.
So our filter is simple - all servers, all hosts, all and only disktemp, all fields- meaning *.*.disktemp.* will work.
Now, we can correct the template - ignore servers, tag the host, tag the measurement, tag the disk, and tag the field - .host.measurement.disk.field.
All together, our template for disk temperature aggregation becomes "*.*.disktemp.* .host.measurement.disk.field". Chuck this into your config:
### [[graphite]]
#...other lines omitted for brevity...
  templates = [
    "*.*.disktemp.* .host.measurement.disk.field",
    # Default template
    # "server.*",
  ]
And restart InfluxDB:
root@grafana:/ # service influxd restart
Wait a few moments for your NAS to report the disktemp metrics - mine took 15-20s. Let’s now have a look in the database to see if it’s correctly parsed our new metric:
root@grafana:/ # influx
Connected to http://localhost:8086 version 1.8.0
InfluxDB shell version: 1.8.0
> use graphite
> select * from disktemp group by * order by desc limit 1
name: disktemp
tags: disk=da0, host=truenas_local
time                temperature
----                -----------
1606067385000000000 28

name: disktemp
tags: disk=da1, host=truenas_local
time                temperature
----                -----------
1606067385000000000 29
...omitted for brevity...
You’ll now see that all the disktemp metrics are aggregated into a single series - split up by the disk, with a field called temperature!
Head to Grafana now and create a new panel - below is the default query that Grafana shows you for your InfluxDB data source.
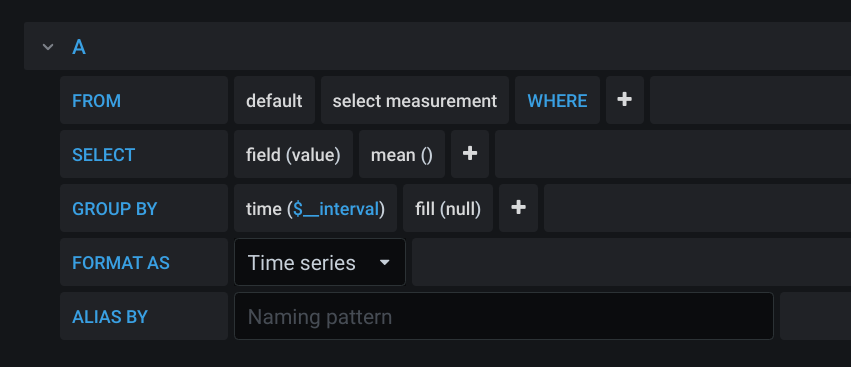
Note how we have an option in the FROM clause to select a measurement - we already set this in our template above using the measurement keyword - in our case, this is disktemp. We also need to change the field selected in the SELECT clause to be the field we set in the template - in our case, this is temperature.
At this point, your graph will have roared into life, but it isn’t showing each disk, just a mean of all the measurements.
So first off, we’ll change the points to a continuous line by adjusting the GROUP BY’s fill function to be linear. Now we’ll change the GROUP BY a little more to separate by the tag we added in our template - disk - you’ll need to add tag(disk). And as if by magic, you should (hopefully) see a graph containing a line for each disk’s temperature.
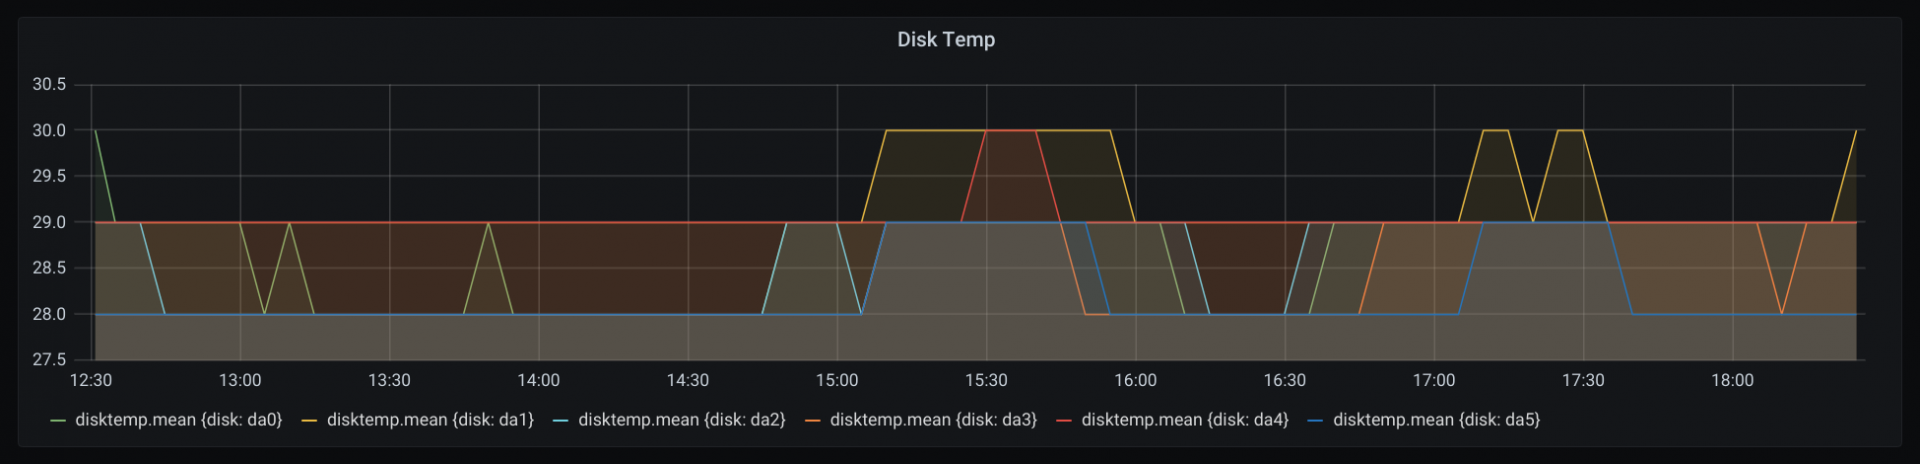
You can see the legend has now changed from disktemp.mean to one for each tagged item in the series!
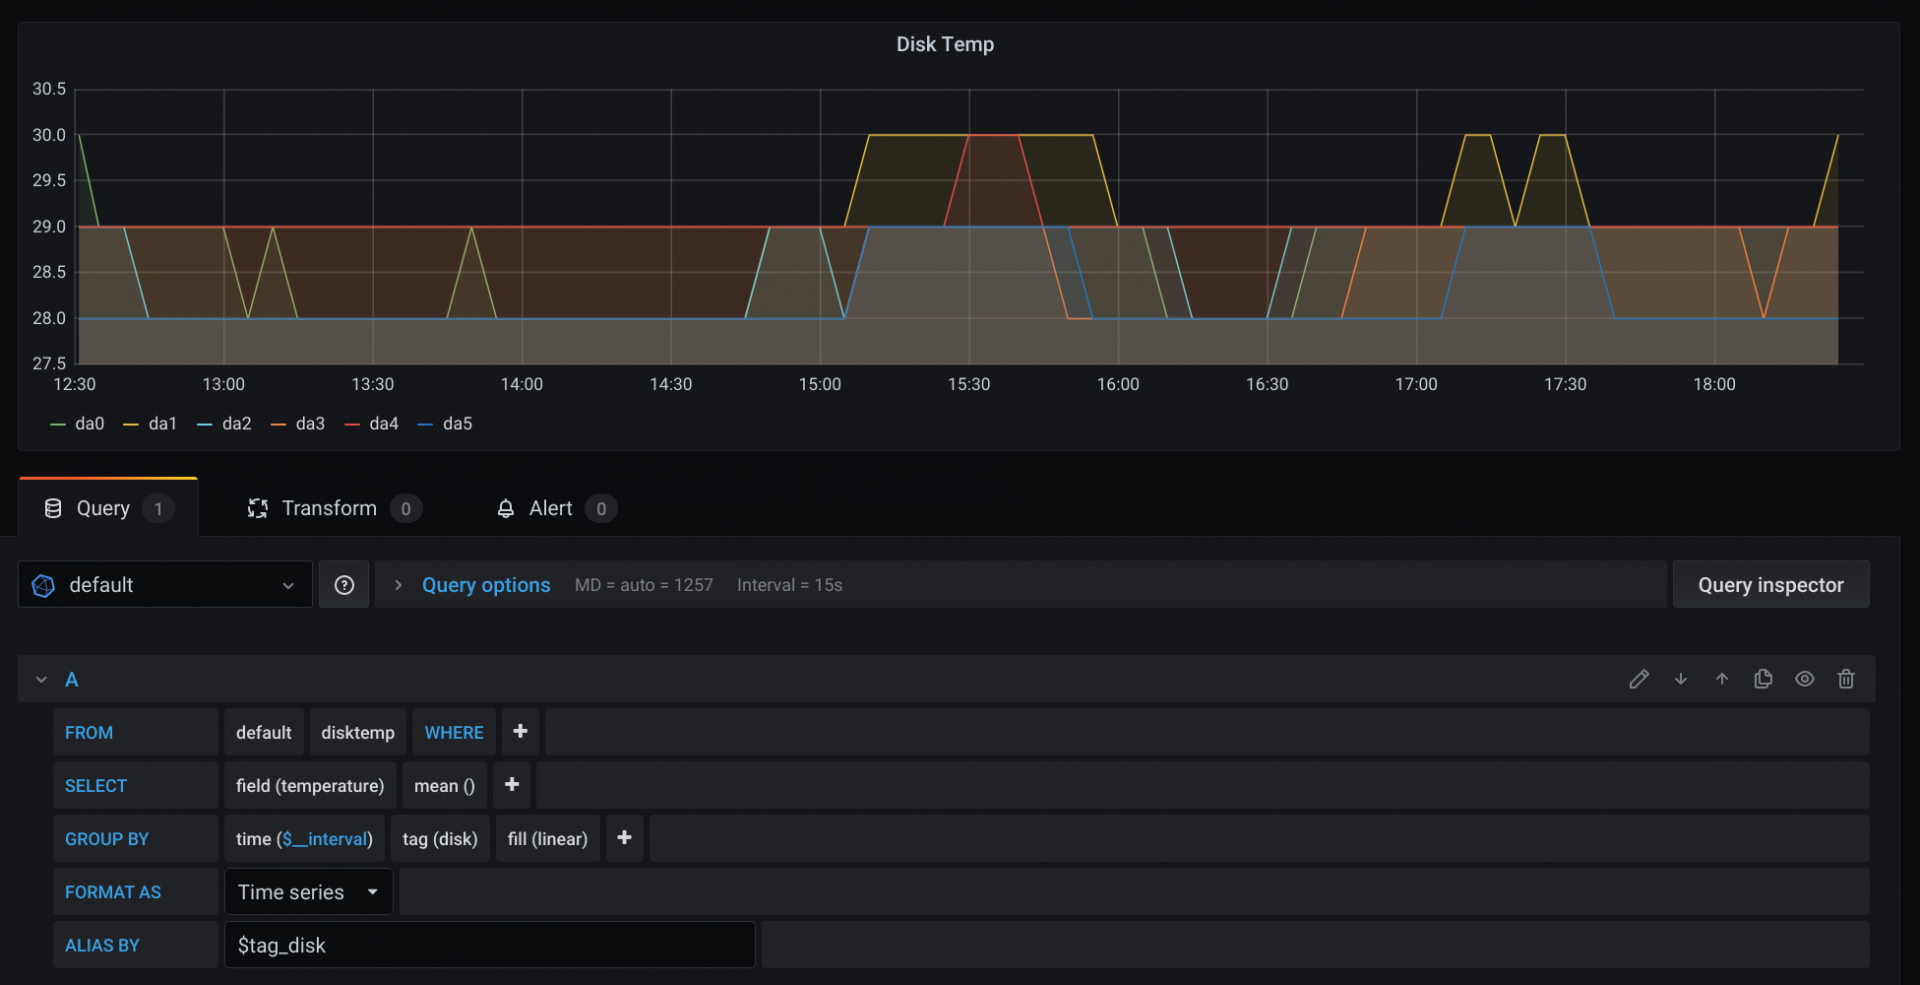
Let’s make it a little less noisy - in the ALIAS BY clause of the query, tell Grafana to use the disk tag - $tag_disk.
Your final graph and query should look like this:
Here are a couple more templates for you to try and figure out the correct graph query - don’t worry, Grafana should give you hints when you’re entering the data.
    "*.*.cputemp.* .host.measurement.cpu.field",
    "*.*.uptime.* .host.measurement.field",
    "*.*.load.* .host.measurement..term.field",
Done!
Here’s the final templates config I have for InfluxDB:
  templates = [
    "*.*.cputemp.* .host.measurement.cpu.field",
    "*.*.uptime.* .host.measurement.field",
    "*.*.load.* .host.measurement..term.field",
    "*.if_octets.* .host.interface.measurement.field..",
    "*.if_packets.* .host.interface.measurement.field..",
    "*.if_errors.* .host.interface.measurement.field..",
  ]
Thanks for reading and I hope you’ve successfully set up a beautiful metrics dashboard!
Footnotes
Not that I can find a link to post here - the plugin directory link 404s! ↩
grafana7is the latest version at the time of writing this post ↩If you’re really curious, here’s my dotfiles - https://github.com/jack828/dotfiles ↩
You can read about the config file in the InfluxDB Documentation ↩